Operating Results
(Millions of yen)
| Dec. 2021 | Dec. 2022 | Dec. 2023 | Dec. 2024 | Dec. 2025 ※1 | |
|---|---|---|---|---|---|
| Net Sales | 47,935 | 47,971 | 50,539 | 52,063 | 50,000 |
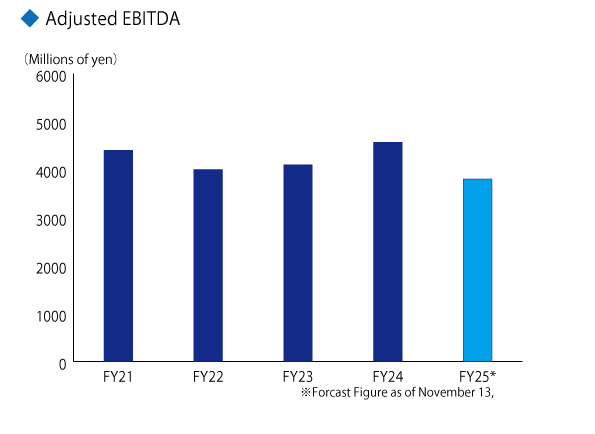
| Adjusted EBITDA ※2 | 4,400 | 4,000 | 4,100 | 4,570 | 3,800 |
| Operating Profit | 3,697 | 3,187 | 3,327 | 3,394 | - |
| Ordinary Profit | 3,668 | 3,158 | 3,118 | 3,361 | - |
| Profit ※3 | 2,476 | 2,093 | 2,473 | 3,096 | - |
| Dec. 2016 | Dec. 2017 | Dec. 2018 | Dec. 2019 | Dec. 2020 | |
|---|---|---|---|---|---|
| Net Sales | 52,521 | 53,268 | 49,906 | 50,683 | 48,539 |
| Operating Profit | 1,202 | 698 | 1,426 | 1,314 | 1,948 |
| Ordinary Profit | 937 | 717 | 1,368 | 1,257 | 1,909 |
| Profit ※3 | 2,039 | 1,100 | 1,319 | 1,500 | 1,669 |
※1 Forecast figure as of February 13, 2025
※2 Adjusted EBITDA = Operating profit + Depreciation + Goodwill amortization + Share-based payment expenses
※3 Profit attributable to owners of parent


